Diversifying The Right Way: A Framework for Calculating the Marginal Efficiency of Your Marketing Channels
An effective channel diversification strategy starts with grounding your thinking in marginal efficiency — not average efficiency. Here's how to do that.
May 12, 2026

You’ve decided you want to diversify your marketing mix — and for good reason. After all, having 90% of your budget going to Meta is risky. What if the algorithm changes or your account gets flagged? Plus, you have a nagging suspicion that YouTube could be highly incremental for your brand.
So you go for it, reallocating some of your budget toward YouTube and away from Meta. Then you run your first incrementality test on YouTube and measure a cost per incremental acquisition (CPIA) of $510. Then compare this to your latest Meta efficiency read of $337 and…yep. Meta is clearly more efficient. You pull back on YouTube — and your diversification journey is over before it began.
But as Haus Measurement Strategist Dean Gordon explains on a recent Open Haus, this method of comparison was flawed from the beginning. Teams shouldn’t be comparing that YouTube efficiency readout to Meta’s average efficiency — they should be comparing it to Meta’s marginal efficiency.
What is marginal efficiency?
Marginal efficiency looks at the efficiency of your last unit of spend — say, that last 25% of budget you’ve added to Meta.
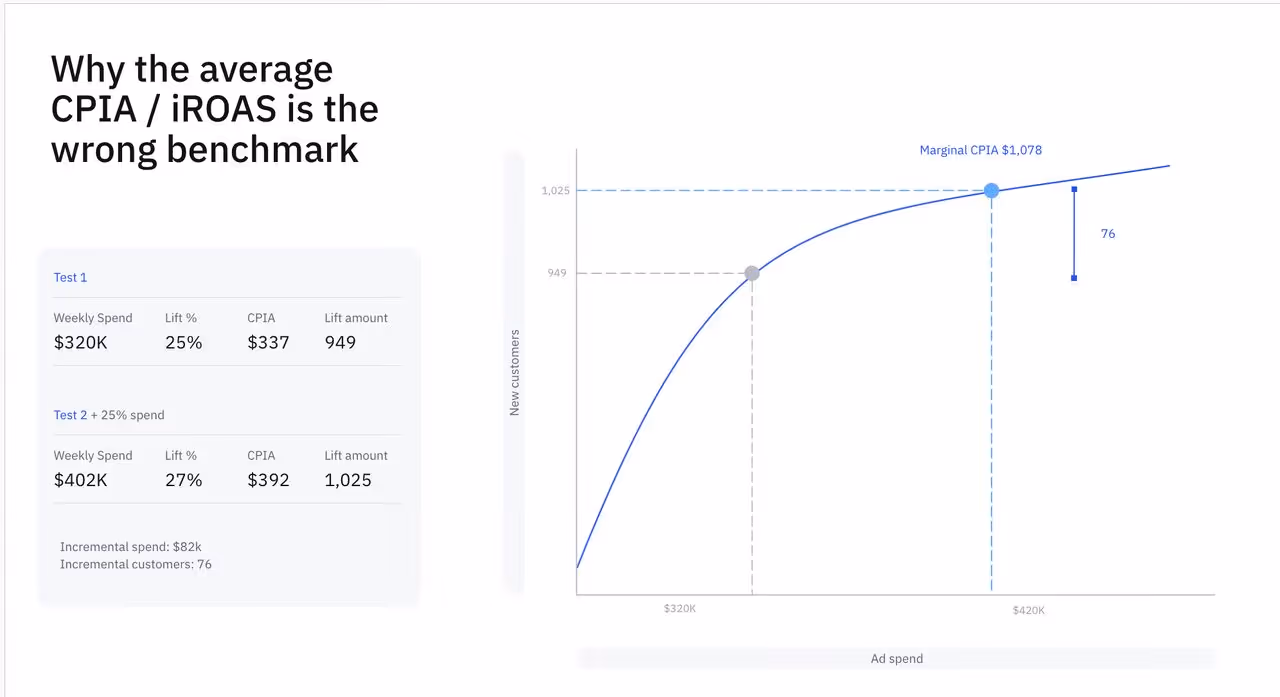
Let’s go back to our original example. You were spending $320,000 on Meta when you made your first noble attempt at diversification. That was the spend level where you measured a $337 CPIA. When you scale Meta up by 25%, you measure a CPIA of $392. Not bad. This beats your efficiency guardrail of $400, and it certainly beats that $510 you saw on YouTube.
But you need to take a closer look. Because when you do, you’ll find that this additional 25% of spend added only 76 new customers. Yes, $80,000 netted you 76 new customers, which is a CPIA above $1,000 and well above that $510 you measured on YouTube.
In actuality, diversifying into YouTube really was the right investment in this scenario, but you wouldn’t know it if you never measured the marginal efficiency.
“If you’re not able to pinpoint the marginal return, there’s no way to really methodically compare your diversified new channels against your primary one,” says Dean. “It doesn’t really matter if YouTube or Snapchat or Reddit has a higher CPIA than Meta in totality — what matters is how it compares to the last dollars you’re spending on Meta.”
But how do you measure the efficiency of those last dollars on your primary channel? Below, we’ve outlined three incrementality test designs that can help you unlock this key data point for your diversification strategy.
Three incrementality tests to calculate marginal efficiency
There are three ways to test spend levels and isolate marginal returns. None are perfect, but all are better than flying blind.
Option 1: Sequential back-to-back tests.
Run a standard incrementality test at your baseline spend level. Then, in a comparable time period, run another test at a higher spend level — say, 25% above baseline. Compare the results to back into what that extra spend actually delivered. It's the simplest setup, but it doesn't control for seasonality since the tests run at different times.
Option 2: 3-cell test with holdout.
You split the country into three groups: a holdout that sees no ads, one group that gets your business-as-usual (BAU) spend, and one group that gets a scaled-up version. Everything runs simultaneously, so seasonality is controlled, making it the scientifically cleanest test — but the trade-off is complexity. You have to duplicate campaigns, and those duplicated campaigns may need time to exit the learning phase before the results are reliable.
Option 3: Stacked spend test.
Haus has a dedicated test type for this. You run your BAU campaigns nationally, then add incremental spend to a subset of the country. The comparison is BAU vs. the "stack" — giving you a clean read on what that extra budget actually does. The watch out: you don't get your average Meta efficiency here, only the marginal read. And you'll want to monitor your BAU campaigns to make sure delivery stays consistent across both groups, since Meta's algorithm may deprioritize regions where there's already heavy spend.
Dean’s recommendation for most brands: start with sequential tests, because they're the least disruptive and still get you to a meaningful answer.
Then, connect your tests to a real budget decision
All of this testing only matters if it leads somewhere. The point of understanding marginal efficiency and running new-channel experiments isn't to validate what you already believe. It's to make a decision.
“Once you’ve gotten these test results, there should be a very clear action plan,” says Dean. “You might commit to reallocating this spend, or commit to putting 10% of your overall media mix into this channel that we have conviction in. All of this should be leading to strong action and not just testing to validate.”
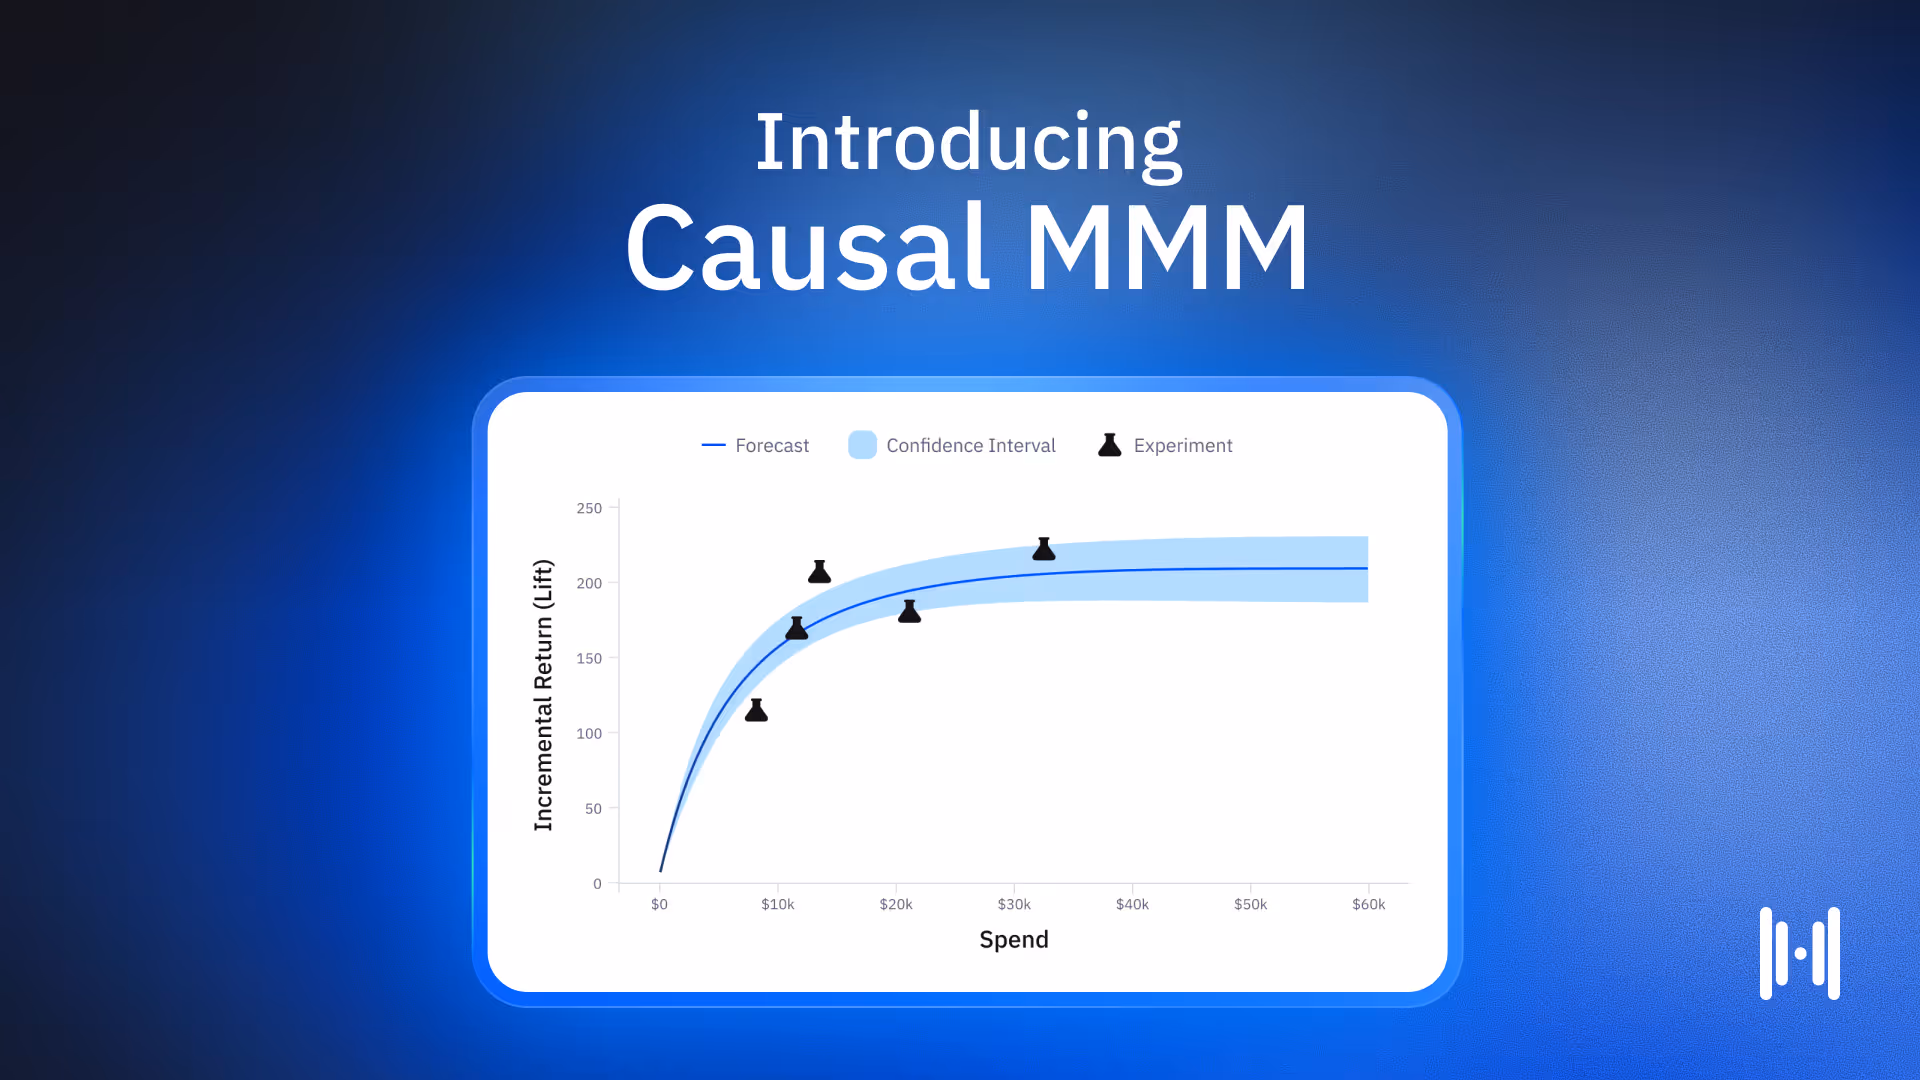
And if you're also running a Causal MMM alongside your incrementality experiments, the model can surface where your saturation curves are bending — pointing you toward which channels are over-invested and where the next dollar is best spent. The experiments then validate and calibrate those recommendations, building a flywheel where each test makes the model sharper, and the model generates better hypotheses for the next test.
The path to real diversification isn't fast, and it isn't tidy. But with the right framework — clear motivations, spend-level testing, fair comparisons, and the patience to develop new channels — it's very much doable. Looking to learn more channel diversification and marginal return curves? Check out Dean’s full Open Haus episode here.
Subscribe to our newsletter
Article Tags
Article Authors

Dean is a Measurement Strategy Lead at Haus, a role he’s held since 2025. Before joining Haus, Dean led customer acquisition initiatives for Ritual, a leading subscription-based health & wellness brand.

.avif)
.avif)

.avif)

.avif)

.avif)
.avif)
.avif)


.avif)


.avif)


.avif)
.avif)
.avif)
.avif)
.avif)
.avif)


.avif)
.avif)
.avif)
.avif)
.avif)
.avif)
.avif)
.avif)
.avif)
.avif)
.avif)
.avif)
.avif)
.avif)
.avif)
.avif)
.avif)
.avif)
.avif)

.avif)
.avif)
.avif)
.avif)
.avif)
.avif)
.avif)
.avif)
.avif)
.avif)
.avif)

.avif)
.avif)
.avif)
.avif)
.avif)

.avif)


.avif)
.avif)


.avif)
.avif)
.avif)


.avif)
.avif)
.avif)
.avif)
.avif)
.avif)


.png)
.avif)
.png)
.avif)