Can A Model Predict Incrementality?: An Interview with Professor Brett Gordon
Stanford Professor Brett Gordon sat down with Haus' Joe Wyer, Olivia Kory, and Phil Erickson to discuss his influential research around marketing measurement and incrementality.
Sep 22, 2026
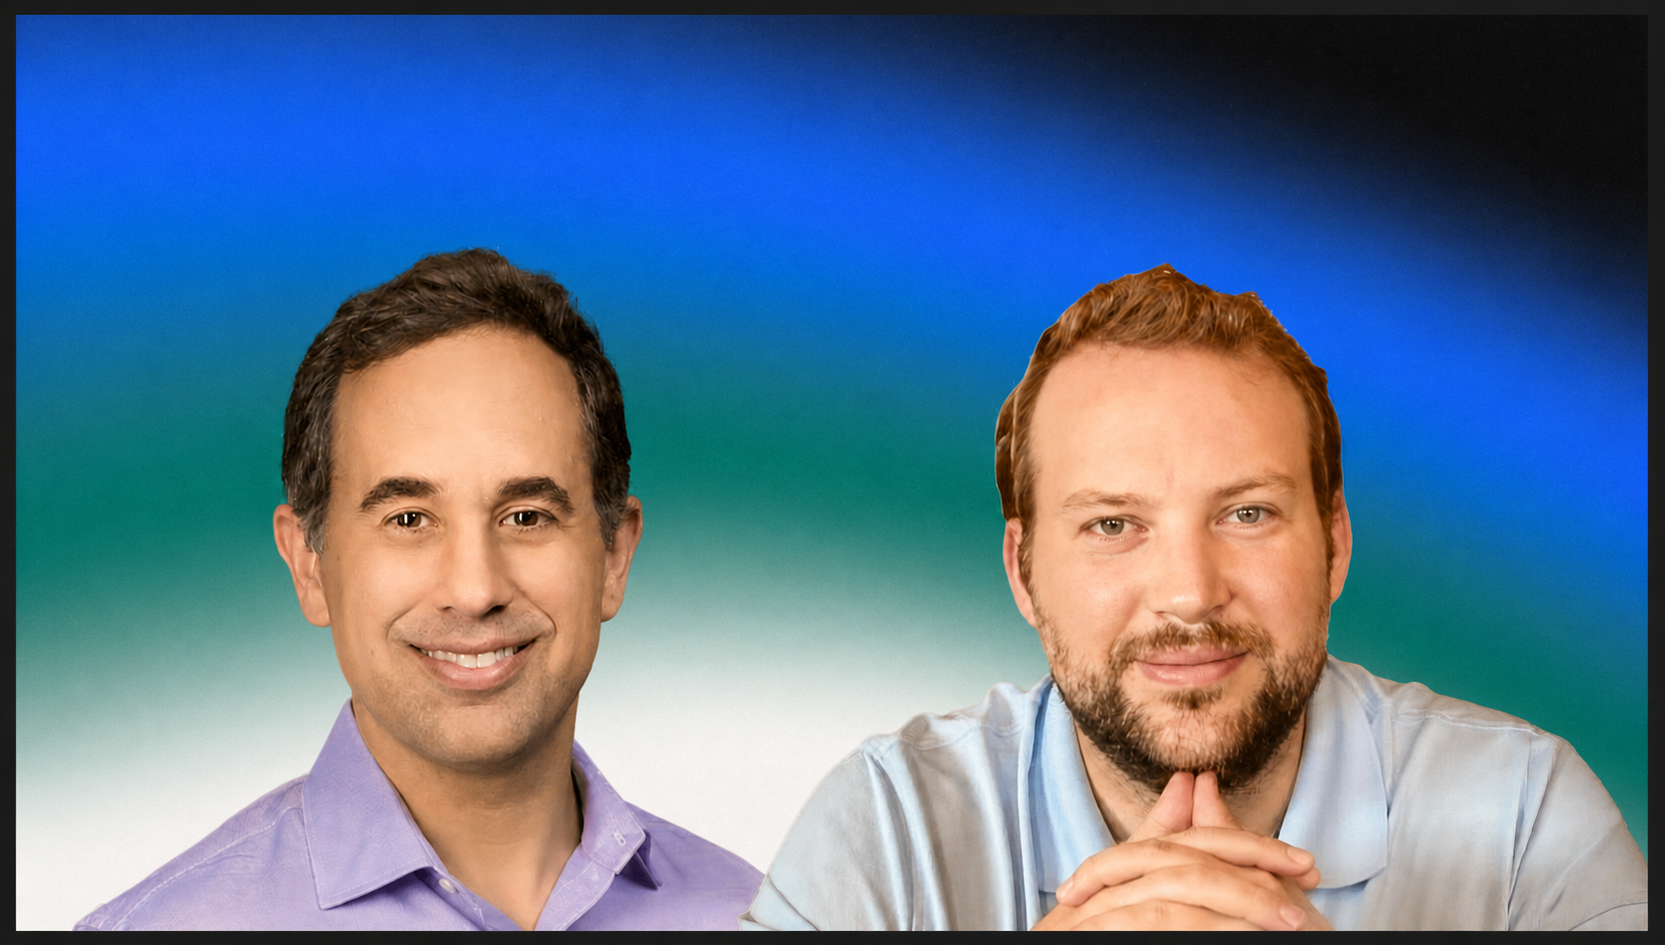
Brett Gordon is the Robert A. Magowan Professor of Marketing at Stanford University’s Graduate School of Business. His research focuses on pricing, advertising, promotions, retailing, and experimentation, using methods from causal inference, machine learning, and empirical industrial organization.
Professor Gordon’s research is required reading at Haus. His “Close Enough” paper brought academic rigor to a problem every measurement team faces: the limits of using user-level data to measure marketing impact.
And his “Predicted Incrementality by Experimentation” (PIE) paper showed how experiments can help predict incremental impact beyond the campaigns directly tested.
Brett sat down with Haus’ Joe Wyer, Olivia Kory, and Phil Erickson to discuss both papers and what they mean for teams that are serious about getting measurement right. Watch the full interview here.
Brett’s research background
Joe: Brett, I’ve been reading your research and following your work since graduate school, but many of our listeners may not be familiar with your background. Could you give us a brief overview of your academic position and research?
Brett: Sure. I recently joined Stanford, where I’m the Robert A. Magowan Professor of Marketing at the Graduate School of Business. For the past 20 years, my research has focused on the intersection of marketing and economics. I use methods from econometrics, empirical industrial organization, and machine learning.
You could boil my work down to one question: How can firms make better decisions in markets where consumers, competitors, and platforms are responding strategically?
Often, firms are trying to answer questions without having direct data. For example, you may want to know what would have happened if you had charged a different price, but you’ve never charged that price before. You have to make an out-of-sample prediction to understand whether that would be a good decision.
My early work was closer to economics. I studied how consumers decided whether to upgrade their computers—for example, whether to buy a new PC immediately or wait for the next Intel chip.I also studied how Intel and AMD competed, including how they made R&D and pricing decisions while selling to consumers who could decide whether to upgrade now or wait.
The “Close Enough” paper
Joe: This work led to research that’s particularly relevant to Haus, including your paper “Close Enough” and your work on predicting incrementality with experiments.
When I was at Amazon, there was a lot of discussion about whether neural networks and machine learning could solve causal measurement problems. Today, people ask similar questions about transformers and AI: Do we still need experiments?
What did you find in your work with Facebook?
Brett: In “Close Enough,” we asked whether observational methods could reliably estimate ad effects using rich, user-level data.
The idea was that advertisers could compare people who saw ads with people who did not, then adjust for demographics and behavioral characteristics. We wanted to know whether that approach was close enough to the answer from a randomized controlled trial.
Meta was an ideal setting because it had both extensive experimentation infrastructure and thousands of observed features about individuals. We analyzed 663 experiments and more than 5,000 user-level features, including ad clicks, likes, group memberships, and other behavioral variables.
We used methods such as double machine learning and deep learning. Despite the rich data and sophisticated models, we could not reliably recover the experimental results.
In roughly 70% to 80% of cases, the model estimates were statistically different from the randomized experiment estimates. The modeled estimates were also typically much larger — often three to six times higher for lower-funnel outcomes.
For example, an experiment might show a 10% lift while the model estimated a 50% lift. For many advertisers, that would not be close enough.
Joe: Did you expect the models to perform better?
Brett: Yes. The result was surprising and disappointing. We had published an earlier paper with a similar finding, but it used only 15 experiments and 30 or 40 features. We worried that the negative result might not generalize to a much larger dataset with better features and more sophisticated methods.
When we began “Close Enough,” double machine learning was becoming increasingly popular. We thought that with better data and better methods, we might finally be able to recover the experimental answers. Instead, the results were consistently poor.
That said, the models did reduce bias relative to a naive comparison. In one example, a naive estimate might suggest a 100% lift, while the model reduced that estimate to 30%. That is a substantial improvement—but the true experimental result was 5%.
The models were reducing bias, but they could not eliminate it because the raw data contained so much bias to begin with.
Joe: So the models weren’t necessarily wrong. The data didn’t support the assumptions required for the models to identify the causal effect.
Brett: Exactly.
Why marketing data is often “bad”
Olivia: You mention often that marketing data is usually “bad.” What does that mean? Is it noisy data, incomplete data, or something else?
Brett: It’s an important and underappreciated question. Data quality isn’t just about whether the data contains errors. In this context, I think about quality as the amount of exogenous variation in the data.
Marketing data is often poor for causal measurement because advertising is highly targeted. Suppose Phil sees an ad and Joe does not. We might try to compare their purchase behavior. Even if we observe that they are similar in terms of age and gender, there may be important differences we cannot observe.
For example, Phil may have recently searched for a new BMW, while Joe hasn’t searched for a car in five years. That latent interest or intent affects both the likelihood of seeing the ad and the likelihood of making a purchase.
Without accounting for those differences, we cannot determine whether the ad caused the outcome or whether the people who saw the ad were simply more likely to buy in the first place.
Randomization solves this problem. If we randomly assign people to treatment and control groups, the groups should be approximately equal not only on observable characteristics, but also on factors we cannot measure—such as whether someone happens to be in the market for a new car.
Clean rooms and causal measurement
Joe: How should we think about clean rooms and marketing data clouds? Can they solve this problem?
Brett: I have limited experience with clean rooms, but my understanding is that they allow advertisers to join datasets they otherwise might not be permitted to access. That can be valuable for privacy and for obtaining additional signals.
However, causal measurement depends on how exposure was generated. Typically, an advertiser using a clean room cannot manipulate the ad-delivery process. Additional data may help you understand the population more granularly, but it does not create randomized variation.
Without some source of randomized variation, the fundamental causal measurement problem remains.
Predicted Incrementality by Experimentation
Joe: “Close Enough” had a major influence on us at Haus. We made it required reading for new hires and shared it with many customers.
But not all hope is lost for observational data. Your later paper, “Predicted Incrementality by Experimentation,” offered a more optimistic direction. When advanced machine learning models cannot estimate incrementality without experimental variation, where do we go from there?
Brett: We didn’t want to tell marketers that they had to run experiments constantly or abandon all hope. The basic idea is to shift the modeling problem from the user level to the campaign level.
At the individual level, there is a fundamental problem: We cannot observe what the same person would do both after seeing an ad and after not seeing an ad.
An experiment gives us an approximation. We have a treatment group and a control group, so we can observe outcomes for both groups at the campaign level.
A regular campaign can be thought of as an experiment where we observe the treatment group but not the baseline — the outcome that would have occurred without the campaign.
With a database of randomized experiments, we have labeled data. We know what happened in the treatment group and what happened in the control group. We can use features observed in the treatment group—such as impressions, clicks, and last-click conversions—to predict the control-group outcome.
If we can predict the baseline, we can estimate the incremental effect of the campaign.
The model is therefore not trying to infer individual-level causal effects. It is learning how to map campaign-level features to a campaign-level baseline and incremental outcome.
Phil: The features include conversions, impressions, campaign type, and other metrics that are available in both experiments and regular campaigns.
Brett: Exactly. We applied this approach to several thousand Meta experiments. The predictive model achieved an out-of-sample R-squared of approximately 88%, compared with about 19% for seven-day last-click attribution alone.
Last-click attribution explained only about 19% of the variation in observed incremental effects. The model explained approximately 88%.
What can we learn from attribution?
Brett: Earlier, we criticized last-click and other attribution metrics because they are affected by selection. But the results suggested that their predictive value may depend on context.
Last-click metrics may be especially biased in search environments because a person who clicks after searching for a product already has high purchase intent.
On Meta, users are generally scrolling rather than actively searching. Someone who clicks an ad may therefore be somewhat more likely to have been influenced by the ad.
I would not treat the 19% and 88% figures as universally generalizable. The relationship will depend on the platform, campaign, and advertiser.
Phil: One question is whether biases can be learned across platforms and advertisers. For example, we know that last-click attribution tends to understate upper-funnel channels and overstate lower-funnel channels.
If we understand those patterns intuitively, perhaps we can characterize similar biases across channels using experimental data.
Brett: I agree that there will be channel-specific differences. Consumers arrive at different channels with different mindsets and purposes, and advertisers use channels differently.
At the same time, consumers are still consumers, so some common patterns may exist across platforms. With the right data, it may be possible to learn shared biases.
I would still be cautious about overgeneralizing. Our findings apply to the samples, data, and time periods we studied. But there is significant potential for broader learning with the right cross-platform data.
Extending the approach across channels
Phil: At Haus, we’ve been exploring whether the approach from your paper can be extended across channels and beyond platform-specific outcomes.
We have thousands of experiments across advertisers, channels, and business outcomes, including total sales and revenue. We’re interested in whether we can use that database to predict total business incrementality from attribution signals.
A standard incrementality factor might compare an experimental ROAS of 1 with an attributed ROAS of 2, then conclude that attribution is overstating performance by a factor of two. The advertiser might then divide future attribution results by two.
The problem is that this is effectively statistical modeling with a sample size of one. We want to use more data to estimate these relationships more robustly.
Geo experiments are useful because they measure aggregate business outcomes, but they are more difficult to run at scale. They can only test a limited number of spend levels, time periods, and channel combinations.
At Haus, we can combine experiments across many advertisers, channels, seasons, spend levels, and business contexts. That allows us to build models that predict experimental outcomes under a wider range of conditions.
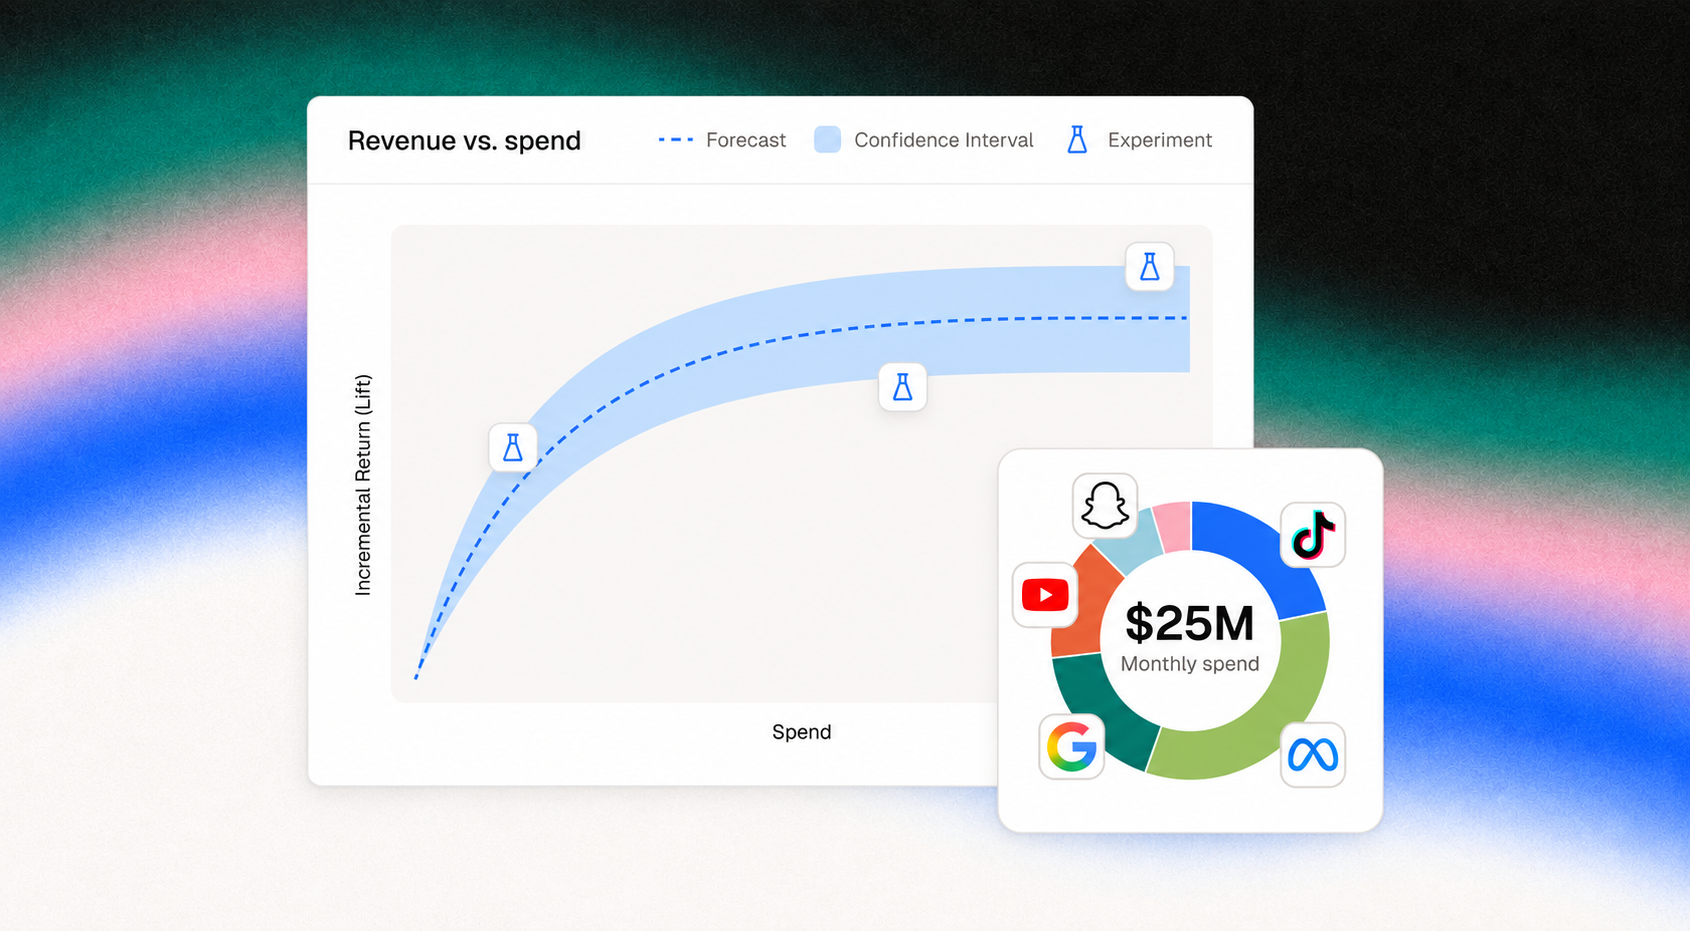
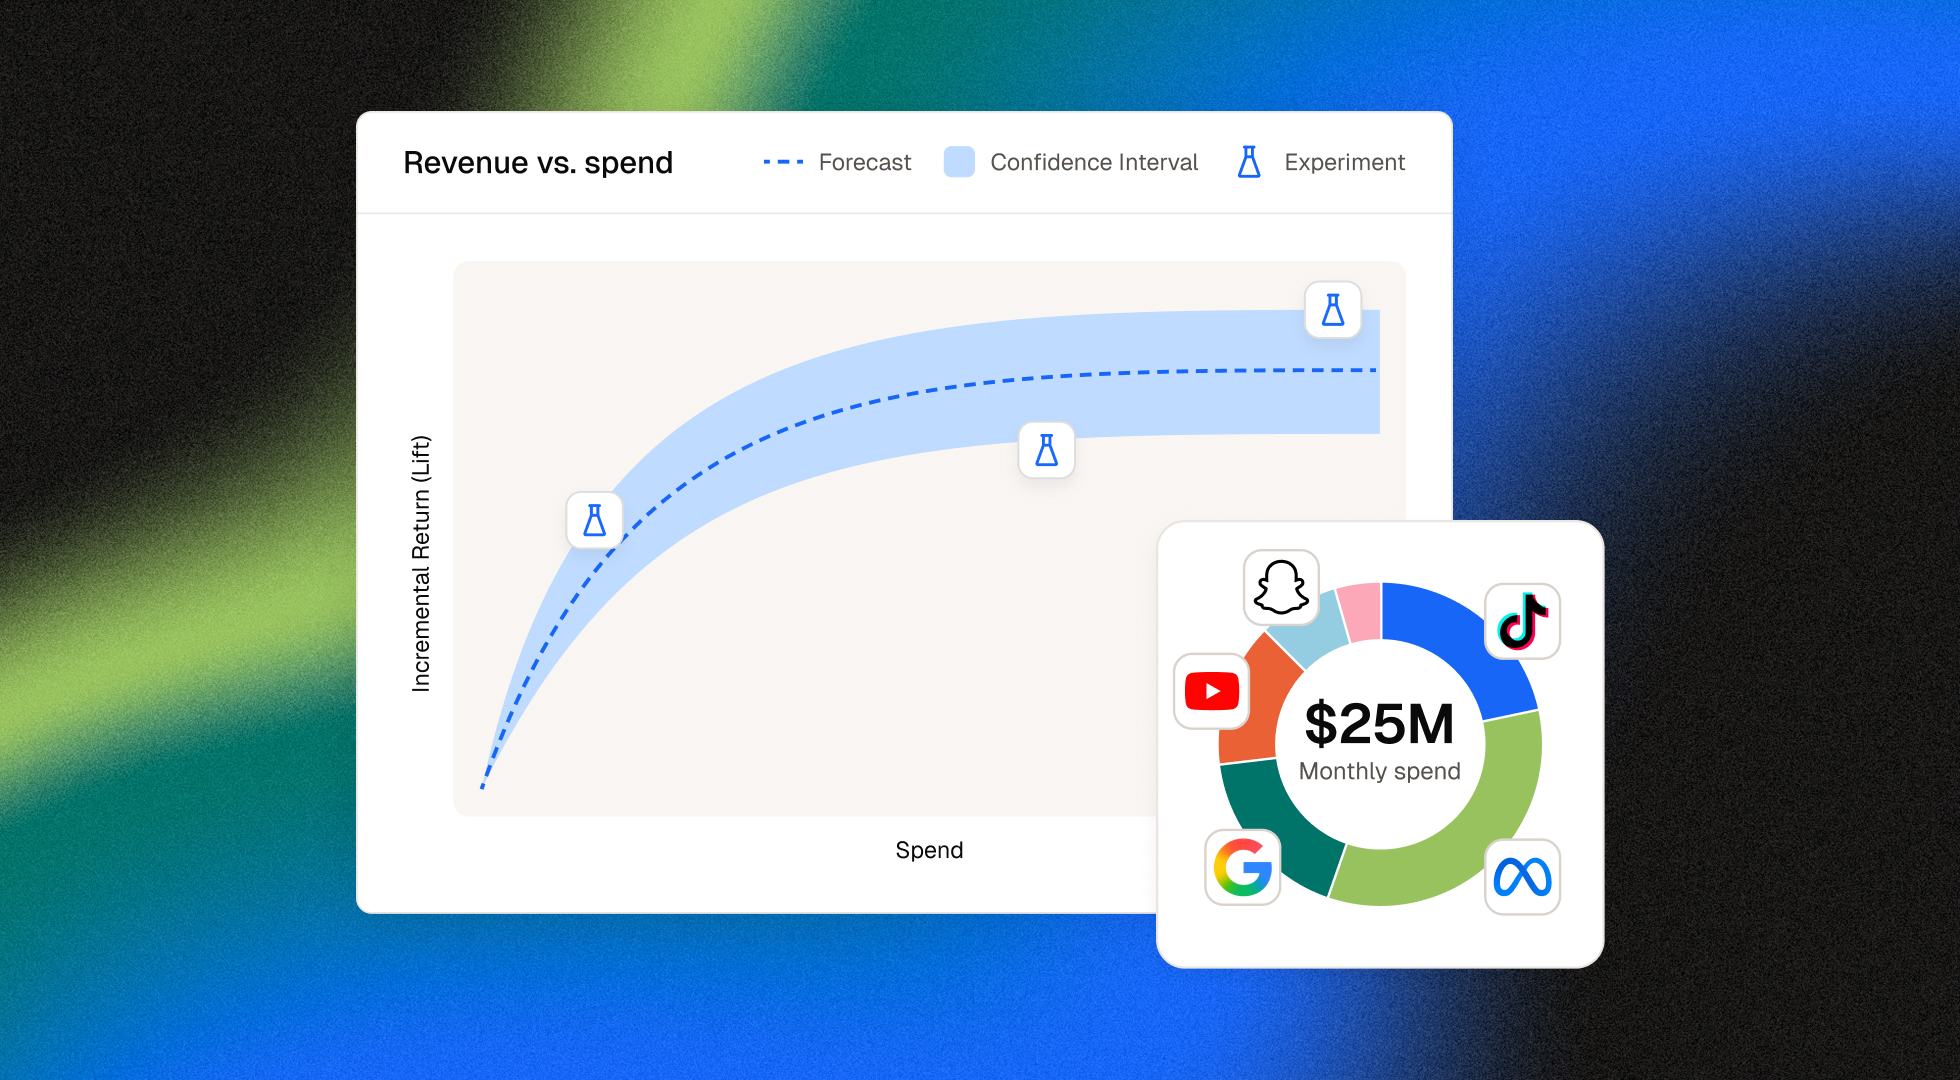
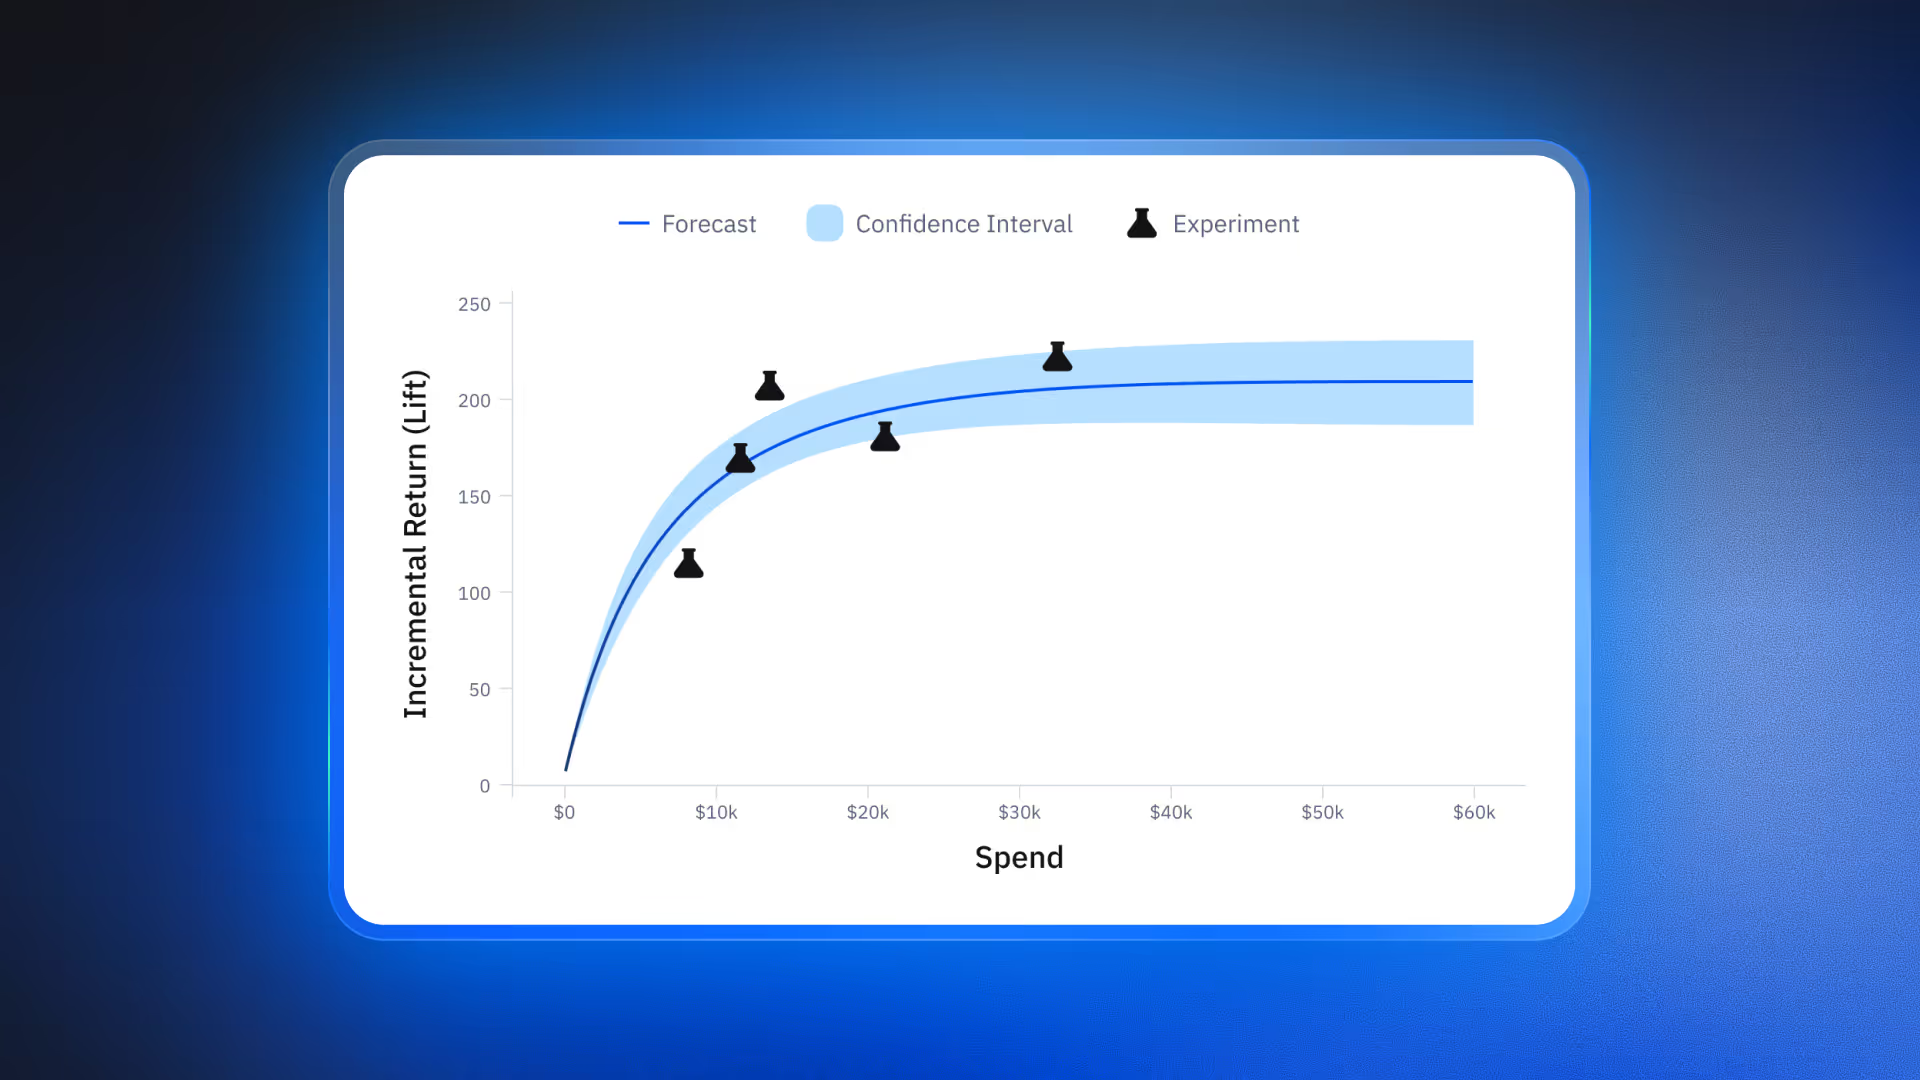
For example, suppose an advertiser spends $40 million annually across three channels and plans to increase Meta spending by $2 million per month. We can use information about the advertiser, channels, spend levels, and historical experiments to predict the expected change in a business KPI.
The initial model predicts aggregate incremental outcomes. We can then compare those predictions with attribution results to characterize and correct attribution bias.
This creates a two-step process:
- Use an experiment database to predict what would happen under an experimental change.
- Compare those predictions with attribution signals to estimate and correct systematic bias.
Attribution models offer more frequent and granular reads, down to the campaign, ad set, or creative level. If we can appropriately debias those signals using experimental data, we can retain that granularity while improving causal accuracy.
When should marketers trust predictive incrementality?
Joe: If predictive incrementality works, how should marketers decide when to trust it and when to run a new experiment?
Brett: A simple incrementality factor is still a prediction. Predictions tend to work well when the training data resembles the data you’re trying to predict.
If you’ve been running similar campaigns, targeting similar audiences, promoting similar products, and operating in a relatively stable market, a model trained on past experiments may reasonably predict the next campaign.
You should be more cautious when the new campaign differs substantially from the training data. For example:
- The training data consists of awareness campaigns, but the new campaign is focused on purchases.
- The training data consists of retargeting campaigns, but the new campaign targets new customers.
- The training data consists of campaigns spending $10,000, but the new campaign will spend $100,000.
- The market, product, audience, or competitive environment has changed significantly.
The key question is whether the available experimental data is sufficiently similar to the situation you’re trying to predict. If it isn’t, you probably need a new experiment.
Phil: Some of our customers ask which experiments in our database are most comparable to their situation. I think the next step is not just showing them similar experiments, but also showing how well the model predicts those comparable experiments.
That provides a fuller picture of coverage: Are the relevant experiments represented, and does the model perform well on them?
Brett: That makes sense. You want to evaluate predictive models based on how well they predict the outcomes that matter — not just how well they perform on average.
You also need to think carefully about how to characterize the space of experiments. It’s not enough to know how many experiments involve purchase conversions or a particular industry. You need to understand the types of campaigns, advertisers, audiences, spend levels, and market conditions represented in the data.
Small advertisers are often underrepresented in experimental datasets because experiments can be difficult or expensive for them to run. Their experiments may also be noisier, which means models may need to help fill in more of the gaps.
The value of advertiser-specific experiments
Phil: We’ve found that predictive models perform better for an advertiser when that advertiser has contributed experiments of their own.
Those experiments help place the advertiser within the broader ecosystem. Even a few experiments can provide useful calibration points, allowing the model to understand how that advertiser compares with others across channels and contexts.
Brett: That makes sense. You can think of it as a sliding scale. If you have no experiments, the model may still improve on naive attribution. As you add your own experimental results, the model becomes better calibrated to your specific business and can use the broader dataset more effectively.
Joe: Brett, this has been an incredible conversation. It’s been extremely valuable to hear about research that has been so influential in the measurement industry and to discuss where the field is heading next. Thanks for chatting with us today.
This interview has been lightly edited for length and clarity.



.jpg)
.png)








.avif)
.avif)

.avif)

.avif)
.avif)
.avif)
.avif)


.avif)

.avif)


.avif)
.avif)
.avif)
.avif)
.png)
.png)
.avif)


.avif)
.avif)
.avif)
.avif)
.avif)
.avif)

.avif)

.avif)

.avif)

.avif)
.avif)
.avif)
.avif)
.avif)


.avif)
.avif)
.avif)
.avif)

.avif)
.avif)
.avif)

.avif)

.avif)
.avif)
.avif)
.avif)

.avif)


.png)
.avif)


.avif)
.avif)
.avif)

.avif)
.avif)
.avif)
.avif)
.avif)
.avif)