What is causal marketing?
Incrementality is the marketing term for causality. An incremental conversion is one that resulted specifically from ad exposure, meaning it wouldn't have happened without the marketing.
May 20, 2026

Incrementality is the marketing term for causality. An incremental conversion is one that resulted specifically from ad exposure, meaning it wouldn't have happened without the marketing.
Think of it like a randomized control trial in healthcare. One group receives the drug (the treatment group), and a statistically similar group receives a placebo (the control group). The difference in outcomes between the two groups is the effect of the drug. Incrementality testing applies the same logic to advertising: Maybe you geo-segment your audience so that one part sees a marketing campaign and another doesn't. Did the group that saw your campaign convert significantly more often? If so, those are incremental conversions.
This is the foundational distinction between incrementality and traditional attribution. Traditional attribution tracks which touchpoints a customer interacted with before converting. Incrementality measures which marketing actually caused the conversion. Attribution has no holdout group. It can tell you which touchpoints were present, but not whether any of them caused the outcome. Traditional MMMs have the same limitation: No holdout group, and a susceptibility to multicollinearity that makes causal inference unreliable.
Incremental return on ad spend (iROAS), which is incremental revenue divided by total spend, and cost per incremental acquisition (CPIA), which is total spend divided by incremental conversions, are the key metrics causal marketing produces. Because they're grounded in experimental results rather than tracking data, CPIA can be compared across all channels, including offline ones.
How causal experiments work
The primary geo-experimentation approach compares geographic markets by creating treatment and control groups across different regions. Treatment regions run the campaign; control regions don't. The difference in outcomes between the two, after accounting for baseline differences, is the measured lift from the campaign.
Good geo-experiments use stratified sampling to ensure balanced representation across treatment and control groups, accounting for factors like market size and seasonality. Haus uses synthetic control methods, which combine and weight multiple control regions, producing results more precise than matched market tests. Haus also uses placebo tests (also called A/A tests), feeding the model a dataset where nothing happened, to confirm that any effect observed during the real experiment isn't an artifact of the methodology.
Geo-experiments work across a wide range of channels. They don't rely on user-level tracking data, which makes them durable as privacy regulations and platform changes continue to affect individual-level measurement.
Other experiment designs exist for situations where geographic separation isn't feasible. User-level experiments, typically run by ad platforms, randomly assign users to see or not see ads; they can detect smaller lifts due to larger sample sizes but are limited to digital channels. Observational studies compare performance before and after a marketing event without a control group, which is useful for major business changes but without the causal rigor of a holdout design.
From experiments to Causal MMM
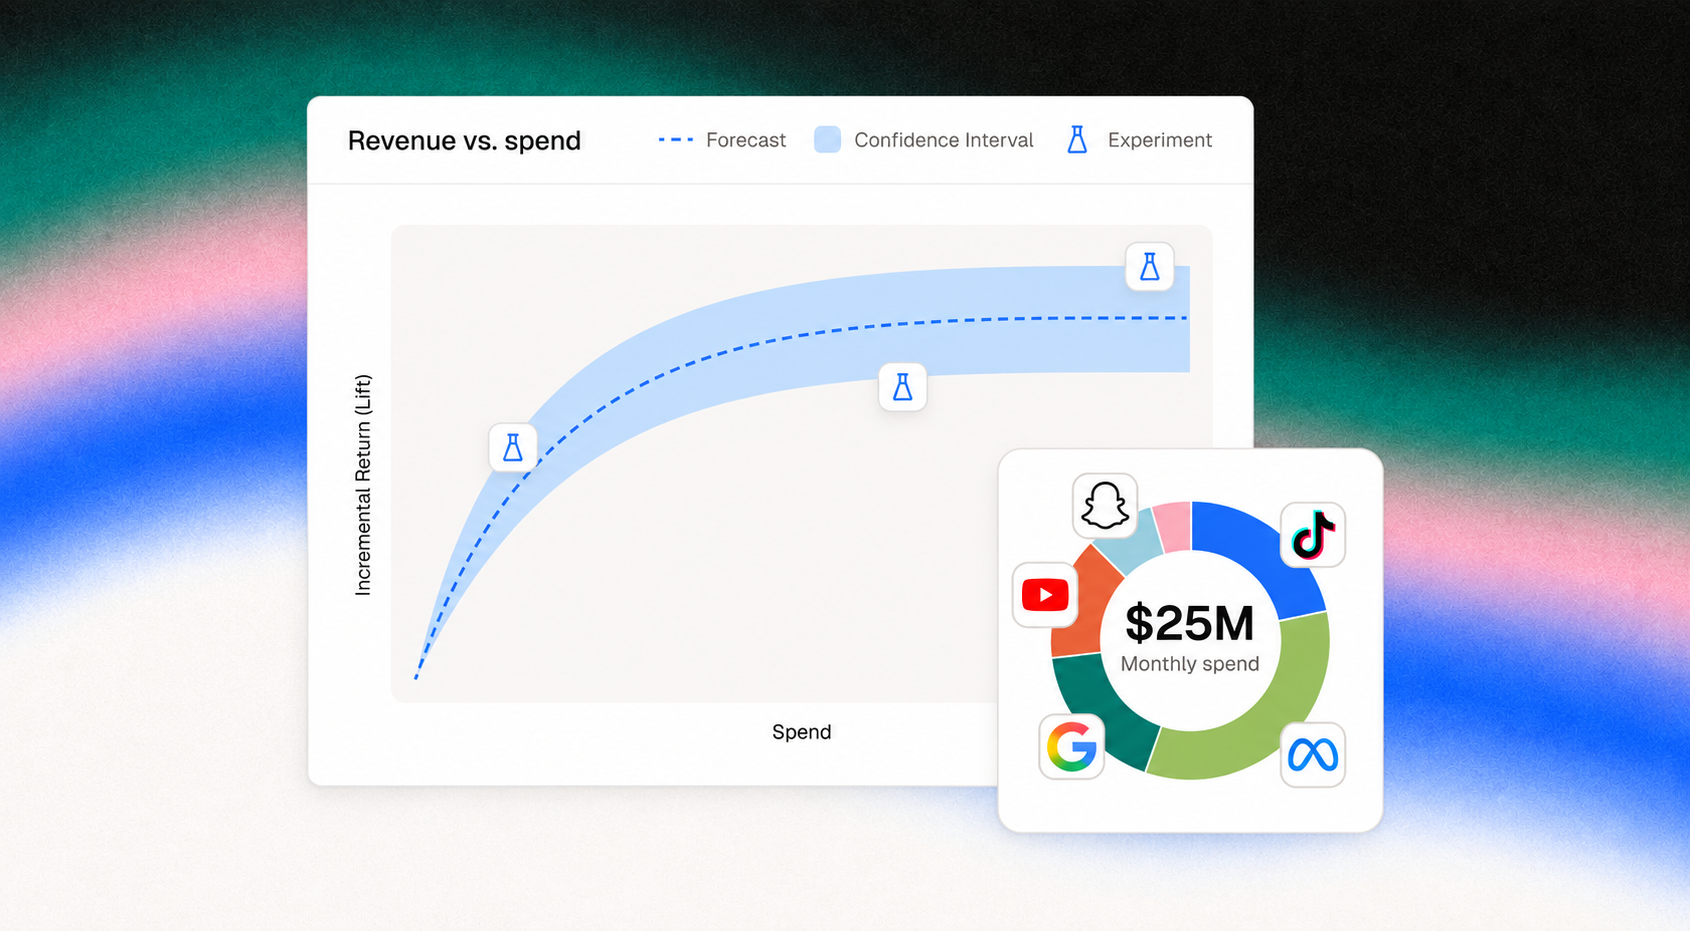
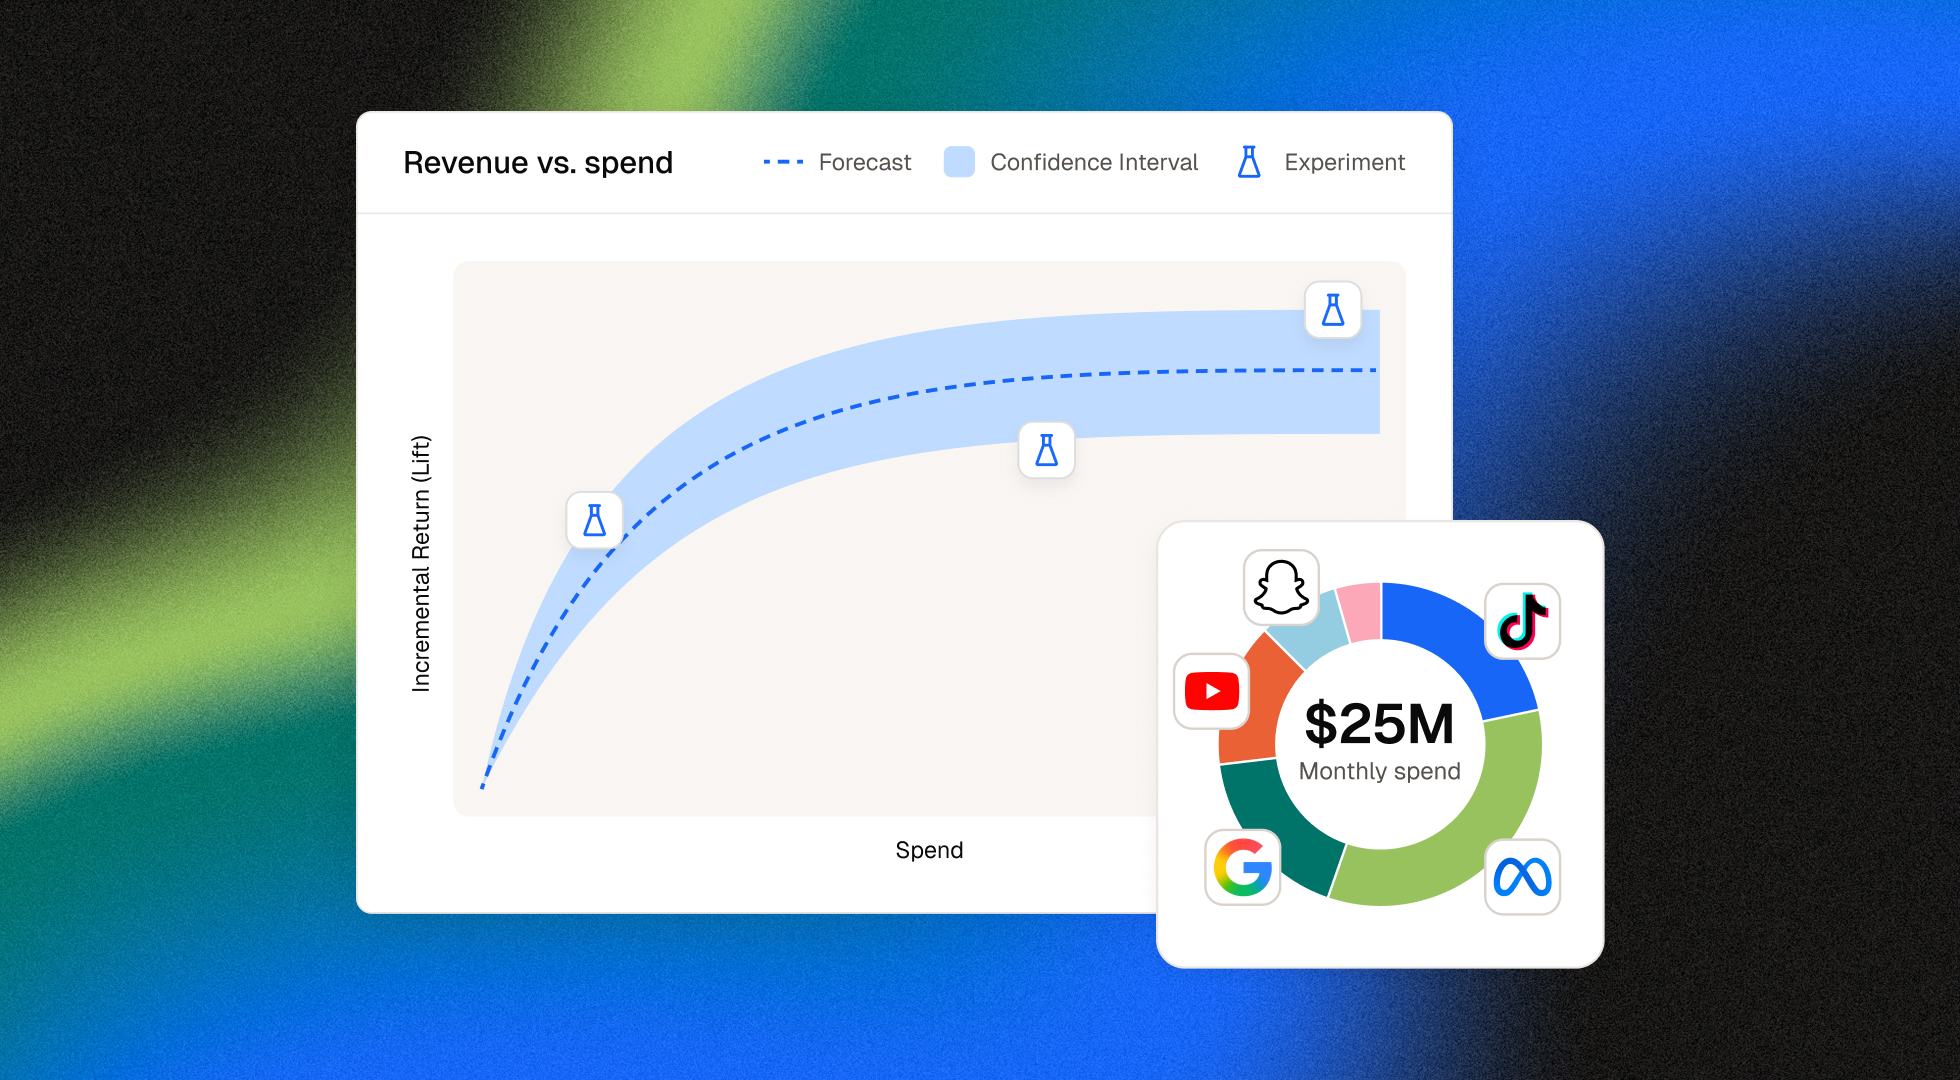
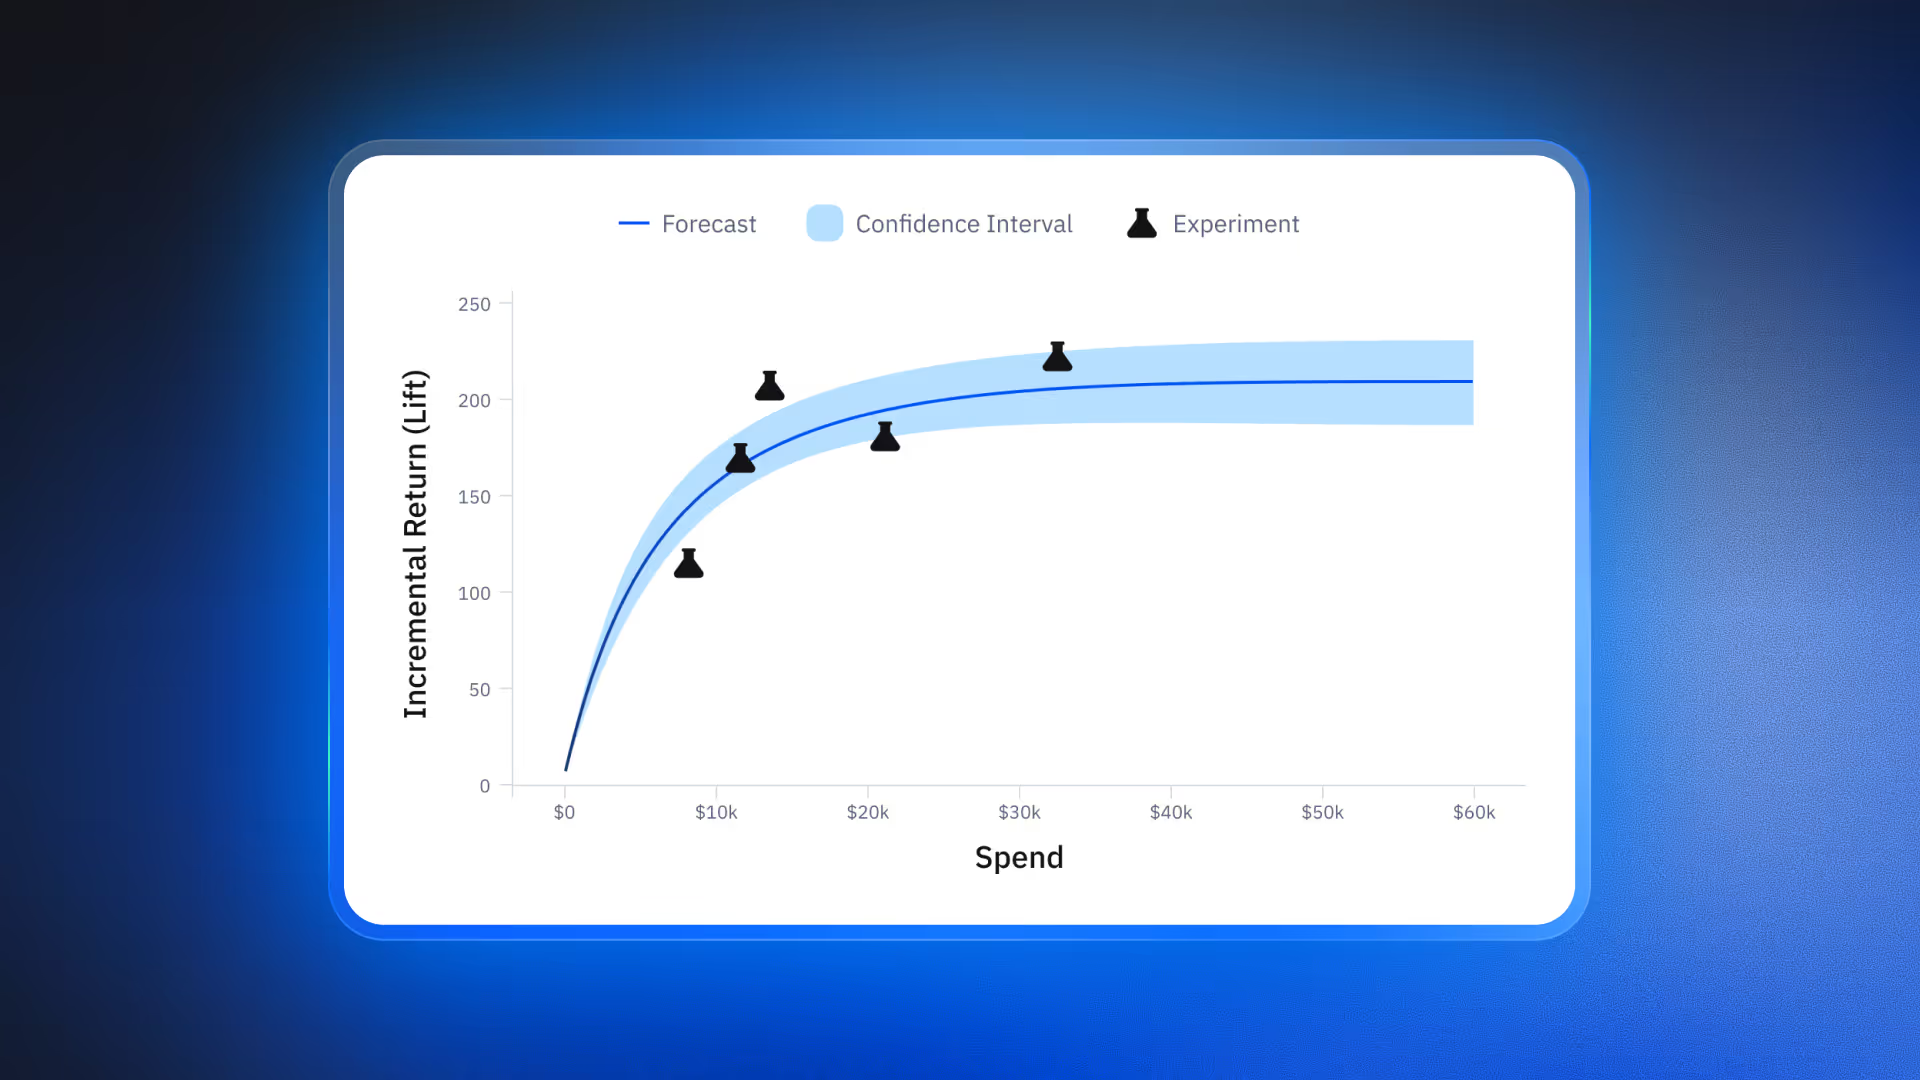
Causal MMM is Haus’ MMM – powered by real-world experiments, not just historical correlations. For channels that have been experimentally tested, the model uses those results directly. For channels that haven't been tested yet, it falls back on observational data plus priors, which can include third-party experiment results as informed starting points.
The difference matters because the source of evidence changes what the model can tell you. A standard MMM is trying to separate signals that moved in parallel, using constraints to keep estimates plausible. Haus’ Causal MMM incorporates actual causal measurements for tested channels, which changes the channel efficiency estimates, scenario planning outputs, and budget optimization recommendations that come out the other side.
OluKai learned this the hard way. Heading into Q4, they'd been relying on an existing MMM vendor whose models consistently recommended prioritizing view-through heavy channels: TikTok, Snap, and YouTube. But their Haus GeoLift results told a different story: TikTok and Snapchat were less incremental than Meta. Acting on the legacy guidance anyway, they shifted incremental budget into those channels and reduced Meta spend. CAC came in 20% higher than predicted, performance deteriorated, and leadership grew increasingly concerned.
When OluKai began using Haus’ Causal MMM, the model, powered by their causal experiment results rather than historical correlations, showed that the view-through channels weren't incrementally driving revenue, while Meta and Google were the most efficient drivers of incremental sales. They made two shifts overnight: Reallocated approximately 50% of view-through channel spend into Meta and reduced total marketing spend by about 15%, right before entering their most important quarter. CAC dropped roughly 20% overnight. Performance improvements held for several weeks, even at lower total spend.
As Ben Bolognini, VP of Ecommerce at OluKai, puts it: "When clear experimentation and directional measurement results disagree, incrementality should win."
What happens when the model gets it wrong
One underappreciated challenge in causal marketing measurement is human bias in the analysis itself. When analysts work with noisy marketing data, they face dozens of small choices with limited objective principles to guide them: Aggregate by day or by week? Exclude outlier dates? Include or exclude certain markets?
A common pattern: An analyst runs an experiment, the result shows zero or negative lift, that feels wrong, so they re-run the analysis with different settings until the result looks more plausible. They aren't trying to manufacture a result. They're looking for something that feels right. But accumulate enough of those small, intuition-driven decisions, and the data stops telling you the truth. You're producing the outcome you expected to see.
Automating model selection with an objective reliability metric addresses this. The goal is to evaluate how reliably a model configuration recovers known truths, not how well it fits historical data, and not how attractive the lift estimate looks. One way to operationalize this: Run placebo tests where both treatment and control had the same marketing activity, and see whether the model reports lift. If it does, it's not trustworthy. Selecting model configurations based on this kind of reliability score, rather than on the result they produce, makes it possible to report an uncomfortable finding with confidence.
At Haus, this approach goes by the name Model Reliability Index (MRI), and it's what enables the system to estimate hundreds of causal models per week, almost entirely without human intervention. The core insight: The only way to scale the truth is to stop touching it.
What causal measurement produces in practice
For a nationally distributed CPG brand selling across Amazon, Target, and other retailers, the question was whether diversifying into more media channels was more effective than maxing out a single-channel strategy, and whether the added operational complexity would be justified by double-digit growth. To find out, they designed a 3-cell test with Haus that ran for two months, with an additional one-month post-treatment window to capture any lagged effects. Forty-five percent of the country saw their new multi-channel media strategy, 45% saw their old single-channel approach, and 10% saw no campaign.
The outcome was definitive: The multi-channel strategy drove 169% more units sold per week, significant enough to unlock double-digit year-over-year total business growth. In retail, growth is often measured in small, gradual lifts over long periods using imperfect panel data. This test showed the opposite is possible: With incrementality testing, CPG teams can get clear, data-backed insights on a much shorter timeline.


.jpg)

.png)









.avif)
.avif)

.avif)

.avif)

.avif)
.avif)
.avif)


.avif)


.avif)


.avif)
.avif)
.avif)
.avif)
.png)
.png)
.avif)


.avif)
.avif)
.avif)
.avif)
.avif)
.avif)

.avif)

.avif)

.avif)

.avif)
.avif)
.avif)
.avif)
.avif)


.avif)
.avif)

.avif)
.avif)

.avif)
.avif)
.avif)

.avif)

.avif)
.avif)
.avif)
.avif)

.avif)


.png)
.avif)



.avif)
.avif)
.avif)

.avif)
.avif)
.avif)
.avif)
.avif)
.avif)